… and sit with them!
Introduction
This lab is a deep dive into group_by()!
Make sure to upload your completed lab to Gradescope by the end of your lab session and commit and push your final version to GitHub.
Learning objectives
By the end of this lab, you will:
- use
dplyrpipelines to arrange, group, summarize, and transform data; - group data by one or more variables and calculate summaries within groups;
- explain how grouping affects the number of rows, columns, and groups in a data frame;
- distinguish between
summarize()andmutate()when working with grouped data; and - understand how to use
.groupsargument insummarize()to control the grouping structure of the output.
Getting started
Clone your lab-2 repository using the same process used in Lab 0.
- Go to the course GitHub organization at github.com/sta199-f26 and click on the repository with prefix
lab-2. - Select the green Code button and choose HTTPS under Clone. Click on the clipboard icon to copy the repo URL.
- In Positron’s Welcome window, click on New Folder From Git….
- Paste the repository URL into the dialog box labeled Git repository URL and select OK.
- Open
lab-2.qmdin the Explorer pane.
Then, click lab-2.qmd to open the template Quarto file and update the authors field to add your name first (first and last) and then your teammates’ names (first and last). Render the document. If you get a popup window error, click “Try again”. Examine the rendered document and make sure your name is updated in the document. Commit and push your changes with a meaningful commit message and push to GitHub.
Guidelines
Code
Code should follow the tidyverse style. Particularly,
- there should be spaces before and line breaks after each
+when building aggplot, - there should also be spaces before and line breaks after each
|>in a data transformation pipeline, - code should be properly indented,
- there should be spaces around
=signs and spaces after commas.
Additionally, all code should be visible in the PDF output, i.e., should not run off the page on the PDF. Long lines that run off the page should be split across multiple lines with line breaks.1
Plots
- Plots should have an informative title and, if needed, also a subtitle.
- Axes and legends should be labeled with both the variable name and its units (if applicable).
- Careful consideration should be given to aesthetic choices.
Workflow
Continuing to develop a sound workflow for reproducible data analysis is important as you complete the lab and other assignments in this course.
- You should have at least 3 commits with meaningful commit messages by the end of the assignment.
- Final versions of both your
.qmdfile and the rendered PDF should be pushed to GitHub.
Packages
In this lab we will work with the tidyverse package.
-
Run the code cell by clicking on the green triangle (play) button for the code cell labeled
load-packages. This loads the package to make its features (the functions and datasets in it) accessible from your Console. - Then, render the document, which loads this package to make its features (the functions and datasets in it) available for other code cells in your Quarto document.
Questions
For each part of each question below, copy and paste the code cell(s) provided into your Quarto document. Run and analyze the output. Then, answer the questions.
Question 1
Throwback Thursday
Review the feedback for your Lab 1 submission on Gradescope and write one sentence about what you learned.
Question 2
Grouping by one variable.
For this question, you will work with the following dataset called df_1. The tibble() function creates the data frame (the tibble object) df_1 with two variables: member and hours. The following code is already included in your lab document.
- What does the following pipeline do? Run it, analyze the result, and articulate in words what
arrange()does.
df_1 |>
arrange(member)- What does the following pipeline do? Run it, analyze the result, and articulate in words what
group_by()does.
df_1 |>
  group_by(member)
Preview, commit, and push your changes to GitHub with the commit message “Added answer for Q1, parts a and b”.
Make sure to commit and push all changed files so that your Git pane is empty afterward.
- Run the following code cell and analyze the result.
- How many rows does the output have?
- How many columns does the output have?
- Is the output grouped? If so, how many groups does it have?
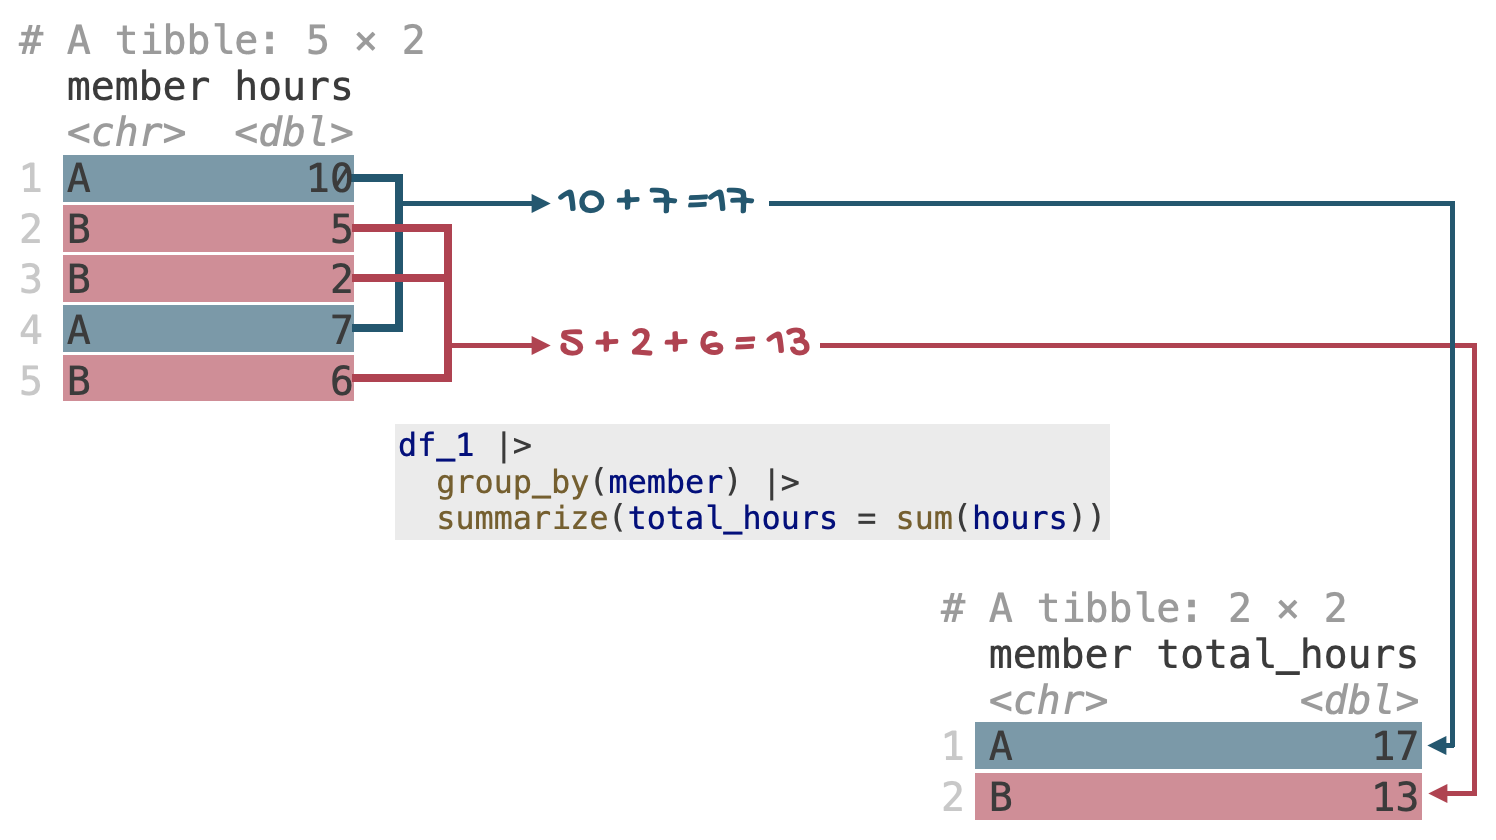
group_by() does- Run the following code cell and analyze the result.
- How many rows does the output have?
- How many columns does the output have?
- Is the output grouped? If so, how many groups does it have?
Preview, commit, and push your changes to GitHub with a meaningful commit message.
Question 3
Grouping by two variables.
For this question, you will work with the following dataset called df_2. The tibble() function creates the data frame (the tibble object) df_2 with three variables: shift, member and hours. The following code is already included in your lab document.
-
How many levels does
memberhave? How many levels doesshifthave? How many possible combinations are there of the levels ofmemberandshift?TipYou can use the
distinct()function to identify the levels of a categorical variable. -
Run the following code cell and analyze the result.
- How many rows does the output have?
- How many columns does the output have?
- Is the output grouped? If so, how many groups does it have?
- What does the message mean?
- Run the following code cell and analyze the result.
- How many rows does the output have?
- How many columns does the output have?
- Is the output grouped? If so, how many groups does it have?
- In the following code cell, we add one more step to the data pipelines from the previous two parts. The new step uses
slice_head(n = 1), which is designed to give the first row of the output. Run each and analyze the result. You will notice the results are different. Why?
# pipeline from part b + slice_head()
df_2 |>
  group_by(shift, member) |>
summarize(mean_hours = mean(hours)) |>
slice_head(n = 1)
# pipeline from part c + slice_head()
df_2 |>
  group_by(shift, member) |>
summarize(mean_hours = mean(hours), .groups = "drop") |>
slice_head(n = 1)- Run the following code cell and analyze the result.
- How many rows does the output have?
- How many columns does the output have?
- Is the output grouped? If so, how many groups does it have?
- Articulate the difference between
summarize()andmutate().
Preview, commit, and push your changes to GitHub with a meaningful commit message.
Wrap-up
Submission
Submit your PDF document to Gradescope by the end of the lab to be considered “on time”:
- Go to http://www.gradescope.com and click Log in in the top right corner.
- Click School Credentials \(\rightarrow\) Duke NetID and log in using your NetID credentials.
- Click on your STA 199 course.
- Click on the assignment, and you’ll be prompted to submit it.
- Mark all the pages associated with question. All the pages of your lab should be associated with at least one question (i.e., should be “checked”).
Make sure you have:
- attempted every question;
- previewed your Quarto document;
- committed and pushed all final changes to GitHub, ending with no pending or staged changes in the Source Control pane; and
- submitted your rendered PDF to Gradescope.
Grading and feedback
This lab is worth 30 points:
- 10 points for attending lab and submitting work by the end of lab; and
- 20 points for correct and complete answers, clear presentation, and following the required workflow.
The workflow portion includes making at least three meaningful commits, pushing the final .qmd and rendered PDF to GitHub, and keeping your work organized.
Footnotes
Remember, haikus not novellas when writing code!↩︎