library(tidyverse) # data wrangling and visualization
library(tidymodels) # modelingSpending your data
Lecture 20
Warm-up
While you wait: Participate 📱💻
Describe logistic regression and identify one aspect of it you are confused about / would like more clarity on.

Go to wooclap.com and use the code OMEXALN.
Announcements
-
My office hours moved to Tuesday, Josh’s office hours are also updated:
- Josh: Tuesday 2-3 pm + Wednesday 4-5 pm
- Mine: Tuesday 3-4:30 pm (I’m giving a talk at the R+AI conference on Wednesday, check it out if you’re interested!)
HW 6 due Wednesday 11:59 pm
Project write-up due Friday 11:59 pm
Week 12 nudges will be coming throughout the week, please make sure to read and don’t hesitate to reach out with any questions!
From last time: Dem flips
Packages
Today’s data
2026 House results and projections from Decision Desk HQ (as of 2026-11-04, 11:14 am), merged with 2024 results (from the gerrymander dataset we worked with earlier in the semester):
midterm_26_raw <- read_csv("data/midterm-2026-11-04-11-14.csv")glimpse(midterm_26_raw)Rows: 443
Columns: 18
$ district <chr> "AK-00", "AL-01", "AL-02", "AL-03", "AL-04", "AL-05", "…
$ state_abb <chr> "AK", "AL", "AL", "AL", "AL", "AL", "AL", "AL", "AR", "…
$ state <chr> "Alaska", "Alabama", "Alabama", "Alabama", "Alabama", "…
$ house_rep_20 <chr> "Don Young", "Jerry Carl", "Barry Moore", "Mike Rogers"…
$ house_party_20 <chr> "Republican", "Republican", "Republican", "Republican",…
$ house_rep_22 <chr> "Mary Sattler Peltola", "Jerry L Carl", "Barry Moore", …
$ house_party_22 <chr> "Democrat", "Republican", "Republican", "Republican", "…
$ house_rep_24 <chr> "Nick Begich", "Barry Moore", "Shomari Figures", "Mike …
$ house_party_24 <chr> "Republican", "Republican", "Democrat", "Republican", "…
$ harris_24 <dbl> 41.41, 21.89, 53.52, 26.18, 15.96, 34.20, 29.68, 61.45,…
$ trump_24 <dbl> 54.54, 76.94, 45.31, 72.71, 83.02, 64.02, 68.47, 37.50,…
$ gerry_22 <chr> NA, "F", "F", "F", "F", "F", "F", "F", "C", "C", "C", "…
$ gerry_24 <chr> NA, "B", "B", "B", "B", "B", "B", "B", "C", "C", "C", "…
$ gerry_26 <chr> NA, "B", "B", "B", "B", "B", "B", "B", "C", "C", "C", "…
$ rating_26 <chr> "Lean R", "Safe R", "Lean R", "Safe R", "Safe R", "Safe…
$ leader_26 <chr> "Republican", "Republican", "Democrat", "Republican", "…
$ margin_26 <dbl> 9.00, 18.00, 8.00, 28.00, 50.00, 7.00, 15.00, 39.00, 35…
$ called_26 <chr> "uncalled", "called", "called", "called", "called", "ca…Data prep
- A seat flips to Democrat if it was held by a Republican after 2024 and a Democrat leads in 2026:
midterm_26 <- midterm_26_raw |>
  mutate(
    flip_dem_24_26 = case_when(
      called_26 == "uncalled" ~ NA,
      called_26 == "called" & house_party_24 == "Republican" & leader_26 == "Democrat" ~ "1",
      called_26 == "called" & house_party_24 == "Republican" & leader_26 == "Republican" ~ "0",
      called_26 == "called" & house_party_24 == "Democrat" ~ "0",
    ),
    flip_dem_24_26 = as.factor(flip_dem_24_26)
  ) |>
filter(!is.na(called_26))- Data split:
Goal
Predict whether a seat flips to Democrat based on Trump’s 2024 vote share for uncalled seats, using data from called seats.
Code
ggplot(
  midterm_26,
  aes(x = trump_24, y = flip_dem_24_26, fill = flip_dem_24_26)
) +
  geom_jitter(
    shape = "circle filled",
    height = 0.2,
    alpha = 0.7,
    size = 3,
    show.legend = FALSE,
    color = "white"
  ) +
  scale_fill_manual(
    values = c("0" = "darkgray", "1" = "#0015BC"),
    na.value = "#A3B18A"
  ) +
  scale_x_continuous(
    limits = c(10, 90),
    breaks = seq(0, 100, 10),
    labels = label_percent(scale = 1)
  ) +
  labs(
    x = "Trump's 2024 vote share (%)",
    y = "Flipped to Democrat",
    title = "2026 House elections",
    caption = "Data from Decision Desk HQ, as of 2026-11-04 at 11:14 am"
  ) +
  facet_wrap(~called_26, nrow = 2, scales = "free_y")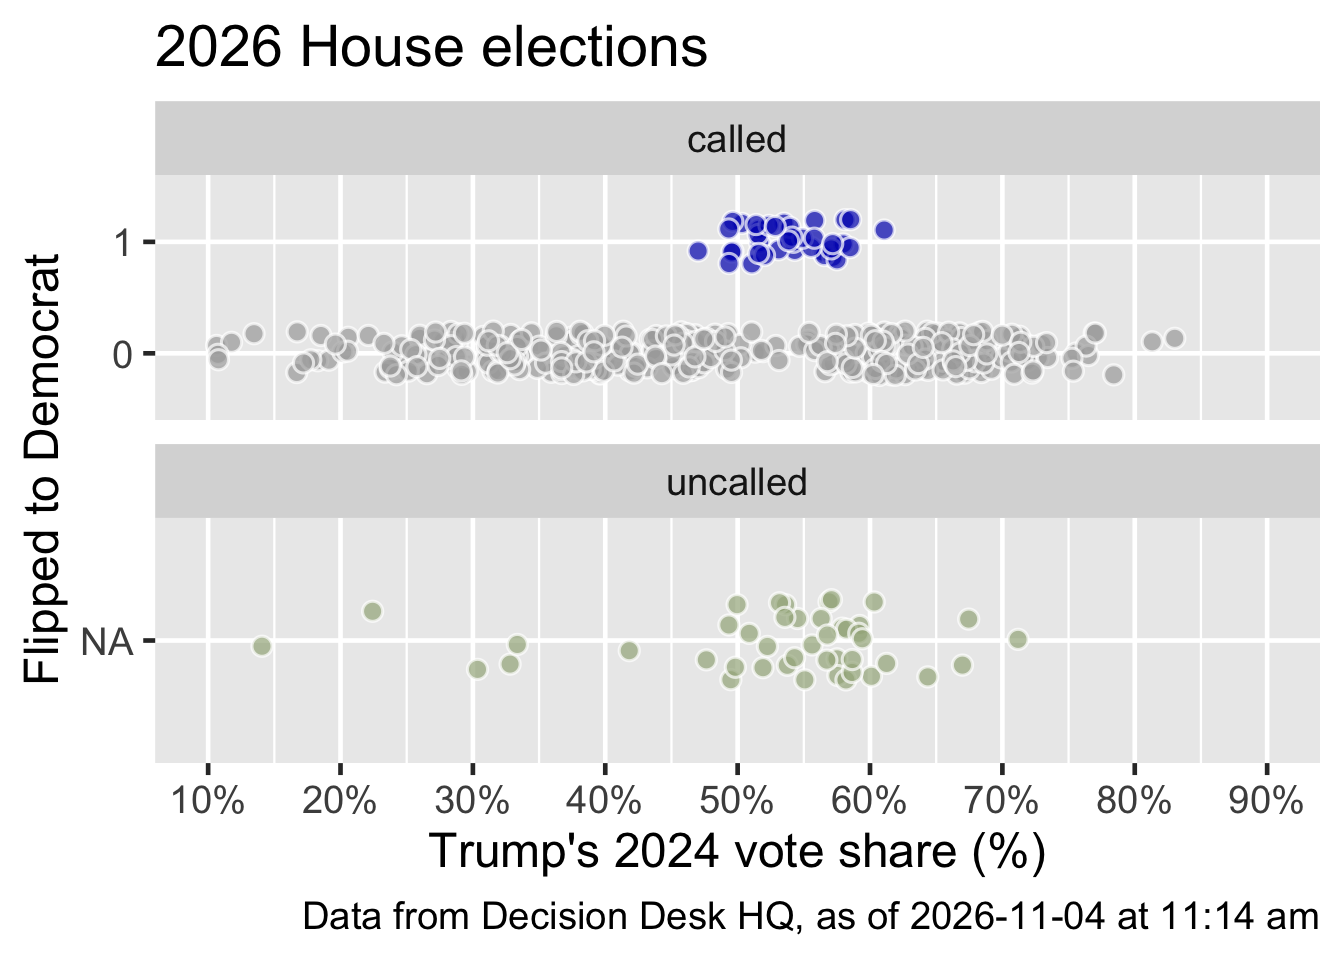
Fitting a logistic model
flip_fit <- logistic_reg() |>
  fit(flip_dem_24_26 ~ trump_24, data = midterm_26_called)

tidy(flip_fit)
# A tibble: 2 × 5
term estimate std.error statistic p.value
<chr> <dbl> <dbl> <dbl> <dbl>
1 (Intercept) -3.48 0.648 -5.37 0.0000000805
2 trump_24 0.0244 0.0117 2.08 0.0372
NoteRemember
In logistic regression, we predict the log odds of the probability of success, \(\log\left(\frac{\hat{p}}{1-\hat{p}}\right)\).
Output \(\rightarrow\) model
- Output
tidy(flip_fit)# A tibble: 2 × 5
term estimate std.error statistic p.value
<chr> <dbl> <dbl> <dbl> <dbl>
1 (Intercept) -3.48 0.648 -5.37 0.0000000805
2 trump_24 0.0244 0.0117 2.08 0.0372 . . .
- Fitted model:
\[ \log\left(\frac{\hat{p}}{1-\hat{p}}\right) = -3.48 + 0.0244\times trump\_24 \]
The intercept
- If
trump_24 = 0, then
\[ \begin{aligned} \log\left(\frac{\hat{p}}{1-\hat{p}}\right) &= b_0 + b_1 \times 0 \\ &= b_0 \\ \end{aligned} \]
. . .
- Exponentiating both sides:
\[ \begin{aligned} e^{\log\left(\frac{\hat{p}}{1-\hat{p}}\right)} &= e^{b_0} \\ \frac{\hat{p}}{1-\hat{p}} &= e^{b_0} \end{aligned} \]
Interpreting the intercept
\[ \log\left(\frac{\hat{p}}{1-\hat{p}}\right) = -3.48 + 0.0244\times trump\_24 \]
. . .
\[ e^{-3.48} = 0.03 \]
. . .
Seats where Trump got 0% of the vote in 2024 are predicted, on average, to have a 3% odds of flipping to Democrat.
Since Trump’s vote share in called seats ranges from 10.6% to 83%, so this is an extrapolation and not meaningful.
The slope I
- Find log odds when the predictor is equal to \(x\):
\[ log(odds_1) = {b_0} + {b_1x} \]
. . .
- Increase \(x\) by one unit and find log odds when the predictor is equal to \(x + 1\):
\[ log(odds_2) = {b_0} + {b_1(x + 1)} \]
The slope II
Difference between the two log odds:
\[ \begin{aligned} log(odds_2) - log(odds_1) &= ({b_0} + {b_1 (x + 1)}) - ({b_0} + {b_1x}) \\ log\Big(\frac{odds_2}{odds_1}\Big) &= b_0 + b_1x + b_1 - b_0 - b_1x \\ log\Big(\frac{odds_2}{odds_1}\Big) &= b_1 \end{aligned} \]
The slope III
Difference between the odds, by exponentiating both sides:
\[ \begin{aligned} log\Big(\frac{odds_2}{odds_1}\Big) &= b_1 \\ \frac{odds_2}{odds_1} &= e^{b_1} \end{aligned} \]
Interpreting the slope
\[ \log\left(\frac{\hat{p}}{1-\hat{p}}\right) = -3.48 + 0.0244\times trump\_24 \]
. . .
\[ e^{0.0244} \approx 1.02 \]
. . .
Seats where Trump’s 2024 vote share was one percentage point higher are predicted to have odds of flipping to Democrat that are higher by a factor of \(e^{0.0244}\approx 1.02\), on average.
Classification
(prediction by another name…)
Predict
How well did our model do for predicting already called house seats?
midterm_26_called_aug <- augment(flip_fit, new_data = midterm_26_called)

midterm_26_called_aug |>
  count(flip_dem_24_26, .pred_class)
# A tibble: 2 × 3
flip_dem_24_26 .pred_class n
<fct> <fct> <int>
1 0 0 353
2 1 0 38Terrible!
Is that surprising?
Predict for uncalled seats
midterm_26_uncalled_aug <- augment(flip_fit, new_data = midterm_26_uncalled)midterm_26_uncalled_aug |>
select(district, trump_24, house_party_24, starts_with(".pred_"), leader_26) |>
print(n = 44)# A tibble: 44 × 7
district trump_24 house_party_24 .pred_class .pred_0 .pred_1 leader_26
<chr> <dbl> <chr> <fct> <dbl> <dbl> <chr>
1 AK-00 54.5 Republican 0 0.895 0.105 Republican
2 AZ-01 50.9 Republican 0 0.903 0.0967 Democrat
3 AZ-02 56.9 Republican 0 0.890 0.110 Democrat
4 AZ-05 59.2 Republican 0 0.884 0.116 Republican
5 AZ-08 57.5 Republican 0 0.888 0.112 Republican
6 CA-04 32.8 Democrat 0 0.936 0.0645 Democrat
7 CA-05 57.6 Republican 0 0.888 0.112 Republican
8 CA-07 33.4 Democrat 0 0.935 0.0652 Democrat
9 CA-11 14.1 Democrat 0 0.958 0.0418 Democrat
10 CA-14 30.4 Democrat 0 0.939 0.0609 Democrat
11 CA-23 57.1 Republican 0 0.889 0.111 Republican
12 CA-34 22.4 Democrat 0 0.949 0.0508 Democrat
13 CA-40 49.5 Republican 0 0.906 0.0938 Republican
14 CO-03 53.6 Republican 0 0.897 0.103 Republican
15 CO-04 57.9 Republican 0 0.887 0.113 Democrat
16 CO-05 53.2 Republican 0 0.898 0.102 Democrat
17 FL-07 55.6 Republican 0 0.893 0.107 Republican
18 FL-09 47.6 Democrat 0 0.910 0.0900 Democrat
19 FL-26 67.0 Republican 0 0.863 0.137 Republican
20 FL-27 56.7 Republican 0 0.890 0.110 Republican
21 LA-05 67.4 Republican 0 0.862 0.138 Democrat
22 LA-06 41.8 Democrat 0 0.921 0.0790 Democrat
23 ME-02 53.8 Democrat 0 0.897 0.103 Republican
24 MI-04 51.9 Republican 0 0.901 0.0989 Democrat
25 MI-07 49.8 Republican 0 0.906 0.0945 Democrat
26 MI-10 52.2 Republican 0 0.900 0.0996 Democrat
27 MN-01 55.1 Republican 0 0.894 0.106 Democrat
28 NC-03 60.3 Republican 0 0.881 0.119 Republican
29 NC-05 58.2 Republican 0 0.886 0.114 Democrat
30 NC-07 56.3 Republican 0 0.891 0.109 Republican
31 NC-08 59.1 Republican 0 0.884 0.116 Republican
32 NC-10 58.2 Republican 0 0.887 0.113 Republican
33 NY-01 54.3 Republican 0 0.896 0.104 Republican
34 NY-02 56.8 Republican 0 0.890 0.110 Republican
35 NY-17 49.4 Republican 0 0.907 0.0935 Democrat
36 NY-21 60.1 Republican 0 0.882 0.118 Republican
37 TN-04 71.2 Republican 0 0.851 0.149 Democrat
38 TX-02 61.3 Republican 0 0.879 0.121 Republican
39 TX-22 58.7 Republican 0 0.885 0.115 Republican
40 TX-27 64.4 Republican 0 0.871 0.129 Republican
41 TX-38 59.4 Republican 0 0.883 0.117 Republican
42 WA-03 50.0 Democrat 0 0.905 0.0947 Democrat
43 WA-04 58.7 Republican 0 0.885 0.115 Republican
44 WA-05 53.6 Republican 0 0.897 0.103 RepublicanApplication exercise
Go to your ae project in Positron.
If you haven’t yet done so, make sure all of your changes up to this point are committed and pushed, i.e., there’s nothing left in your source control pane.
If you haven’t yet done so, pull to get today’s application exercise file:
ae-11-dem-flips-logistic.qmd.Work through the application exercise in class, and render, commit, and push your edits by the end of class.